Q&A with... Ludovic Tavernier, Data Consultant and Data Visualization Lead
By Alan Hylands

Analysts Assemble is back for another round of interviews with data professionals from across the wide data spectrum. This time we have French data visualization lead Ludovic Tavernier in the hotseat.
I’ve been looking forward to finishing this one for about six months. Our original conversation got cut short with
the arrival of Ludovic’s first child earlier this year - which was a more than acceptable excuse to put an interview on hold!
Let’s hear from Ludovic now on how he got into data, where he developed his skillset and how he thinks
other data folks should be working to push their own skills on.
Tell us a bit about yourself, how did you get into the data space and what does your data journey look like so far?
Hi, I’m Ludovic Tavernier and I’m a Data Consultant and Data Visualization Lead in a French data consultancy agency named Valoway.
My work consists in supporting clients in their technical data needs and leveraging the value behind their data legacy. I am also involved in my company growth participating in recruitment, sales and pre-sales activities.
I began my data journey in my engineering school with a Masters focused on Business Intelligence and data mining. My first internship, more than 7 years ago, was mainly about benchmarking two growing softwares: Qlikview and Tableau Software.
After that, I joined a data consultancy firm in Paris where I learned more about building and maintaining data environment for the following years.
In 2017, I decided to come back to the tool I tried a few years back: Tableau Software. Aside of my daily work routine, I learned more about Tableau and data visualization.
I discovered the Tableau community and took part of some dataviz challenges. It ended by bringing my first professional Tableau-related projects and by participating in the Tableau Software IronViz Finale in 2018!
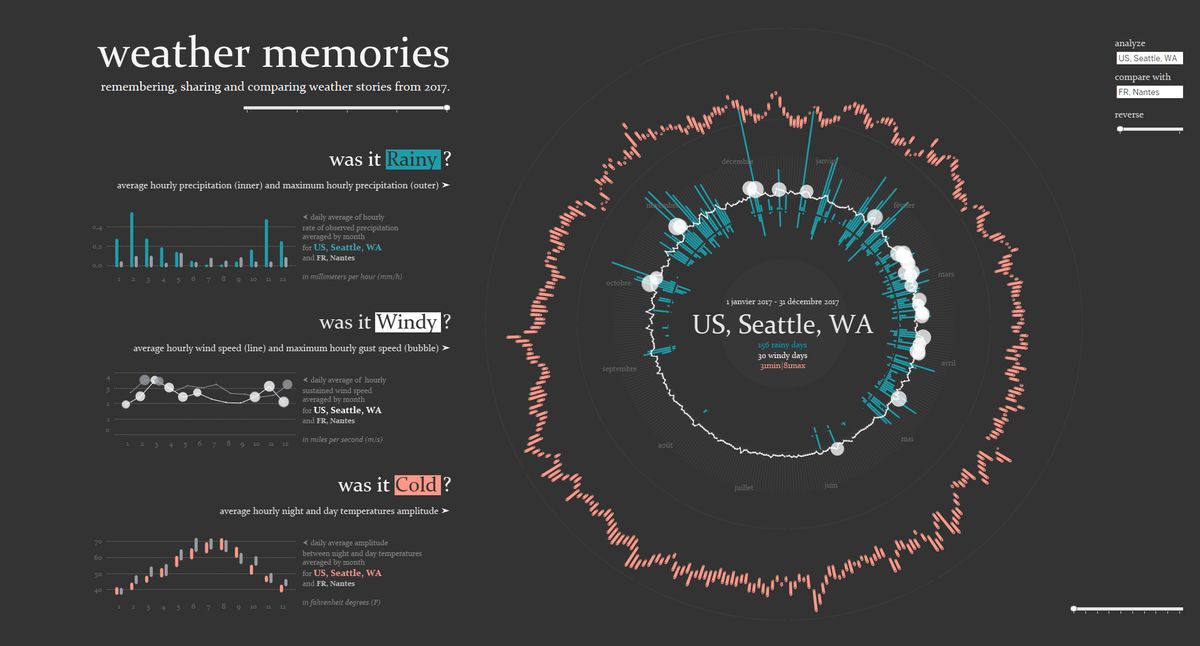
(Weather Memories built in 20 minutes during Tableau IronViz Contest)
Now, I continue my work in traditional data environments but with much more focus on data visualization. I teach and explain basic concepts of it and keep learning at the same time!
What’s a typical day look like for you in your current data role? Which tools and languages do you use? Big team/small team/lone wolf? Remote/office based/co-working space?
My day work is like data visualization: it depends!
I work at my client’s office most of the week. But more and more I can perform my consultant job remotely. This is a game changer, it avoids heavy transport durations and lets me focus on the job to be done (and more).
I tend to be a technical guy, but I enjoy teaching and supporting my clients in their data journey. Especially when it comes to Tableau or Data Visualization.
I have used a good variety of tools, from databases like Oracle, MySQL, Teradata, SAP Hana to reporting softwares like Qlikview, Power BI, Toucan Toco and, of course, Tableau Software.
I also used some ETL with a good understanding of SQL language.
You’ve been building up a good following through your blog and social media. How important do you think it is for data professionals, at all stages of their career, to share publicly what they are doing and learning?
Thank you! I can be shy about what I am doing, less about what I am learning. I would say people do not need to share everything publicly from the beginning.
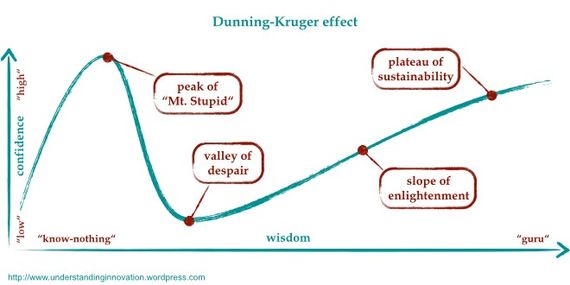
If you know about the Dunning-Kruger effect, the Mount Stupid is a dangerous place for every data professional to be because we feel confident enough to teach what we “poorly” know. And if we have a voice in social media, it can be disastrous for our readers.
But it is a good moment to share what we do, to receive feedbacks and to go deep into the valley of despair. I personally began to teach Tableau and to give feedback during my journey in the slope of enlightenment. I think it is the good moment to do it.
I do hope to reach the plateau of sustainability in the data visualization field during my lifetime, to feel confident enough to share every type of content.
Where do you see your own data career going next? Building on your technical skills or moving into a more management-based role?
I first want to improve my data visualization skills, learn new languages and tools to perform better in that field (like d3.js or Adobe Illustrator). I am sure it will lead to new great experiences.
Both building my technical skills and moving to a management-based role are attractive though. And I do think the two are correlated. Keeping practicing is crucial as the technical data landscape is always and quickly changing.
If you had a list of “best-kept-secrets” (websites, books, coaches) that have helped you, which would you recommend?
I encourage participating in challenges, for me it was #makeovermonday or #SWDchallenge. I encourage welcoming feedbacks from the community you are in (for me it was the Tableau community).
And my best-kept-secret is people in general. I try to follow as many as possible to keep getting inspired in my field.
What is the number one piece of advice you give to aspiring data professionals?
Practice! Everything is about practicing and courageously confronting the science you want to master. Oh and keep in mind there is always better than us!
Where can readers find you online?
You can find me on Twitter at @ltavernier7, on LinkedIn, on Tableau Public or my blog.