How To Tell Stories With Data
By Alan Hylands

Why do we want to tell stories with our data?
Run a SQL query. Bung a few tables of raw numbers on a spreadsheet. Do a quick bar chart if you’re feeling artistically inclined. Then fire it over to the requestor and the job’s a good ‘un.
Right? No, not right. Not at all.
That’s like opening a restaurant, hiring the finest chefs, giving them the most wonderful ingredients…but only letting them serve up dry toast.
Meanwhile, your competitors are serving the full range of flavoursome offerings their kitchen can deliver and they are hoovering up your customers to rave reviews.
Your place wouldn’t last a week. And the same applies to tech.
When we have so much rich data at our disposal, how can we ensure none of its value gets left on the table?
We can use that data to tell stories about our business.
And this chapter of Analysts Assemble serves up a deep dish of advice in how to do that.
Where does storytelling fit into the world of data and analytics?
For Data Analysts, a massive part of our job is to uncover new knowledge and then share it with decision makers.
It can’t be just any random information though, it has to be something they can take actions on the back of. We do this to help them make better decisions for the benefit of our business AND our customers.
It’s pretty simple when broken down to that level: use our many, varied skills and talents to learn useful new things, and then share what we’ve found to make our worlds better.
Like I said, simple. Errr…
So how do we, as data analysts, give ourselves the best odds of influencing our partners and stakeholders at all levels of the business across departments and silos?
How do we empower those movers and shakers to take on board what we’ve told them and enact real actionable business decisions on the back of that newfound knowledge?
That’s where storytelling comes in.
But I’m not a good writer…
Whether it’s for human eyes or as AI skills, writing is often our primary means of communication in the workplace.
We all have the potential to be good writers and we prove it every day of our working lives.
Working async on Slack, Google Docs, Coda etc. would be impossible without being able to break down what we’re working on and how that applies to the people we are working with.
But we can all be better. Better writing means better storytelling means better communication means better chance of influencing and empowering others.
What do you know about telling stories, Alan?
I haven’t just been around the block. I’ve been around a FEW blocks. When I wasn’t feeling fulfilled in my working career as a finance analyst, I took the chance over the years to write on the side.
That brought forth some pretty crappy unpublished short fiction, a tonne of half-baked story ideas, some data-related articles that reinvigorated my love for this field, and a short-lived but long cherished spell as a professional football writer for the New York Times Company.
I don’t think that means I know any more than anyone else but all of the reading about the art of storytelling and actually rolling my sleeves up, fighting the existential fear of not being any good, and hitting the keys anyway must add up to something.
Let’s take a look at some of my non-exhaustive, prone-to-change, hastily pulled together tips for How To Tell Stories With Data and see how they help you think differently about your own data storytelling skills.
How to tell stories with data.
Everyone fears the blank page

There is nothing more horrifying in the world than staring at a blank screen and realizing that you are the one who has to fill it. Even worse is when you then realize that you are expected to chop away at least 10-20% of those words at the end of it all.
I’ve spent years so terrified of what that blank page will do to me that I’ve neglected writing completely. I know writing itself is painful (or, at least, it is to me). Having written is one of the best feelings in the world but the actual writing itself can feel like pulling your heart and internal organs out through your mouth.
Too much info? Maybe.
Truth? Definitely.
But I want to make the point that if the blank page scares you and you feel like you don’t particularly enjoy the writing process then you aren’t alone. Only thing to do is go do it anyway. And once you’ve typed that first sentence, the page isn’t blank any more. Victory is ours.
Fight through the mid-writing trough of extreme sorrow.
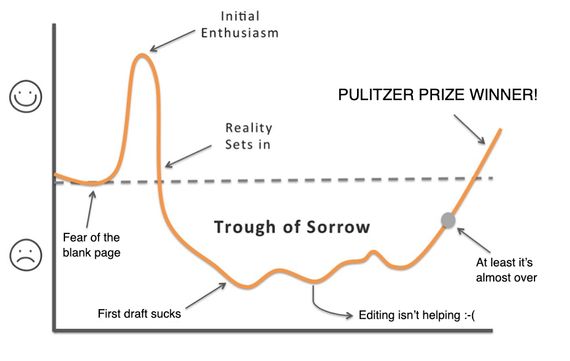
Keep pushing through. REM said it best. Everybody does hurt sometimes and especially when you’ve poured your analytical heart out onto a page and it feels like a kindergartener could have done it better.
Leave it. Come back tomorrow or the next day with a fresh eye. I promise it won’t be as bad as it seemed at first glance. Edit it a few times then get someone else you trust to go over it.
There is no writing problem that can’t be solved with a good night’s rest and coming back to look at it with fresh eyes. Even if the answer is sometimes to highlight the whole section and hit the Delete key.
Let your own voice shine through.

Finding your own voice is one of the most important things you will ever do as a writer. Nothing elevates the quality of your storytelling in any format quite like bringing your own personality to the page. There is an untold liberation in being able to speak your truth in your writing in the way you would say it yourself in “real life”.
Ever wondered why so much business writing is dull, lifeless, insomnia-curing borefests? Me too. From our school days onwards, we’re trained that “creative writing” is this thing over here, and “business writing” is this totally different thing way over here.
And never the twain shall meet.
It takes a lot to rewire our brains when we start to attempt to tell stories with data. You’re part of a community of some of the funniest, most intelligent, highly insightful, brilliant data analysts in the world.
You won’t have gotten over the door at many of the places you’ve studied or worked without passing LOADS of interviews and getting vetted by a multitude of folks.
If they didn’t think you had something interesting to say and a voice worth listening to, you wouldn’t be there. So let’s hear YOU tell the story.
Stephen King says “Write more, read more”.
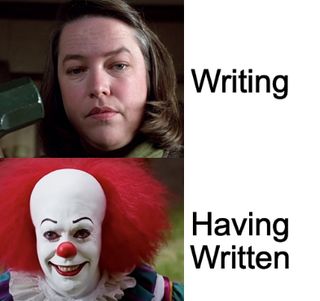
I’m a self-confessed Stephen King fan boy middle-aged man. (Yes, yes, fans of Misery, I’m his number one fan.)
When it comes to writing stories I’d take any advice he has to give so when he says “If you want to be a writer, you must do two things above all others: read a lot and write a lot”, I listen.
I don’t read as much as I used to. I don’t write as much as I should. Sorry Stephen, I’ll try to be a better writer, I promise.
It makes sense though. We learn from reading what we think good looks like. We get better at learning how to do it ourselves by actually trying it out. I can’t recommend his book “On Writing” enough to help get inside the mind of one of our greatest ever storytellers.
One of my favourite pieces of advice Stephen shares is where he dispels the notion of waiting for some kind of divine inspiration to strike before you sit down and get started writing.
Stephen says:
“My muse may visit. She may not. The trick is to be there waiting if she does.”
In other words, you have to be sitting at your desk if you want the genius fairy to visit.
Writers write so sit down, open up that blank page and get started. Who knows where the journey might take us?
One thing to always look forward to is that sweet dopamine rush when we finish and have something we’re proud of sitting there in front of us on the screen.
Who are you writing for?

The culture of the company is important to gauge early on but just as important is the level you are pitching your data story to. Best case scenario is something of interest to all levels and all vertical silos. That’s not easy to pull off but get an interesting subject and you’ll be able to cross multiple boundaries.
The level of technical or domain expertise needed to understand the story can be ramped up with a more specific piece (e.g. just for the Customer Support team or just for Business Development) but even there, you don’t want to make it too high brow and formal.
And always be careful of the perils of over-using jargon and acronyms. People need to understand what the hell you’re talking about without flicking off the page constantly to Google/ChatGPT the meaning of another 3 letter acronym.
Do the work for your reader up front - tell them what you mean.
So what?

We can’t avoid the numbers in data writing but it’s the story that people stay for. Always be looking for the story behind the numbers.
Usage went up. Why?
Usage went down. Why?
And when you’ve found out the “why” then tie the section together with the “So What?”
I had a lightbulb moment early in my Zapier career when our Head of Data pointed out to me in the edit phase that I’d done the “So What?” for some sections but not all.
TLDR; EVERY section needs a So What?
If you can’t come up with a valid reason for that section of writing to be in your story then you either:
a) don’t understand it well enough yourself and need to give it more consideration
or
b) if it doesn’t have one then you might have found the willing sacrifice for your edit.
Sometimes it takes a village to write a story.

Photo by Rob Wingate on Unsplash
Don’t be afraid to ask your colleagues for additional context. Find the ones who give good notes, these are like gold dust. Treasure them and always try to be supportive when they ask you to return the favour.
We should all be trying to support each other in writing great stories, making time to support everyone’s efforts. Writing high quality, data-led content that drives discussion and action in our business is a team sport.
It might feel like a solo run when you’re sitting tapping away at the keyboard but we’re all here with you, pulling in the same direction with the same objective.
Take advantage of that when and where you can.
To help make sure I get full value from the data org hive mind, I’ve taken to keeping notes and saving Slack threads where I notice a possibly interesting story and commentary from a knowledgeable colleague.
When I need more topics for exploratory data analysis, I can use these to help guide the initial questions and, when it comes to writing time, I can use these to kick off quotes and knowledge transfer from the OP to me then on to our readers.
It’s the circle of (knowledge) life in action.
Murder your darlings.

Find an unemotional editor.
They will tell you that you have to be brutal in your approach to deleting the words you have sweated and agonised over for hours. But you won’t want to. You’ll go back to edit your post and find it’s grown by an extra thousand words by the time you’ve gone through it all. You’ll weep and feel the pain deep within your soul. But you’ll learn to chop and chop and chop some more until the chopping is done.
Then leave it for a day and come back to tinker and chop some more. It hurts but it’s worth it. First drafts are invariably horrible and need to be rewritten, chopped, changed, rewritten again and then poked and prodded into shape by continuous improvement.
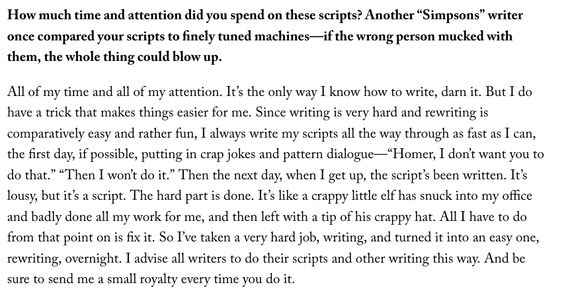
This does not mean you are a bad writer. First drafts are for quantity. Edits are for quality. Repeat this to yourself regularly.
To reinforce this I’m going to directly quote from an interview with the legendary writer of many of The Simpsons most famous and well-loved episodes, John Swartzwelder, in the New Yorker.
Grab their attention - and keep it.

Keeping your reader’s attention is the most important thing.
Overly verbose, drawn out, loquacious, babbling, long-winded, protracted, blathering, meandering, torturously padded narrative loses readers’ attention and you have to hold onto it until the end.
Hold on like it’s a set of horse’s reins and you are dangling over the edge of a skyscraper (see Arnold Schwarzenegger in True Lies).
How do we actually grab and keep the reader’s attention though?
There are several key areas you have to focus on to be successful here.
-
The Headline might be your only opportunity to get them to even open the page. Don’t waste it and don’t just use the first one that comes to mind before publishing. Write several and tweak the life out of them until the best one bubbles up to the top.
-
Hook them with your opening. It’s easy to write a long, rambling monologue before you’ve worked your way through the rest of the story but nothing is as guaranteed to lose readers as a slow, boring intro. ALWAYS rewrite it after you’ve written the rest of your story and pull the reader into the body of the work early.
-
Knowing who your ideal audience is will help you tailor your story to their specific hopes, fears, dreams and heartfelt desires. Making the reader feel like the story was written to address them personally draws them in and gives them the feeling of having some skin in the game.
-
Stories are about people first and foremost. Make your reader care about what you are telling them by including that human element in it. Even in a business context, it’s possible to stick to this. Make the readers empathise with the people in your story and you’ll have a better chance of keeping their attention to the end.
Writing a good news post is easier than a bad news story.

Why? It doesn’t challenge the reader too much especially if they have skin in the game. Everyone likes a pat on the back. No-one enjoys a (metaphorical) poke in the eye.
But that doesn’t mean we have to shy away from bringing up those difficult conversations altogether. Think of yourself as an “objective journalist”, not a sycophantic “client journalist”, and you’ll be on the right tracks.
We can all think of examples of projects that haven’t exactly gone to plan. It’s inevitable in the fast moving, constantly changing environment we operate in. But we should all work hard to avoid the kind of blame culture that can exist in other companies.
Just because you made a breaking change to code doesn’t make you a bad engineer. Launching an initiative that didn’t quite meet expectations doesn’t make you a bad product manager.
Our role in helping our colleagues report these results is to objectively present the facts. The facts count. Don’t omit ugly facts, or sugarcoat them. Just give the facts in a neutral tone.
But do so with empathy. Be part of the team in your language. Show how we’re disappointed too. And build some hope before you leave; try to get people excited about how the problem can be solved with the learnings.
What happened and how it played out IS the story in this case, just as much as if it had been a runaway success. And sometimes we learn more from studying how things went wrong than we do when they go right. And we’re all about the learning here.
Storytelling isn’t only about the words.
I’m horrible at design. I look at some of the #MakeoverMonday Tableau competition designs and they are like artwork. Mine are more like 1997 web-pages in their aesthetic quality. If a picture says a thousand words then what does that say about my bog-standard bar charts?
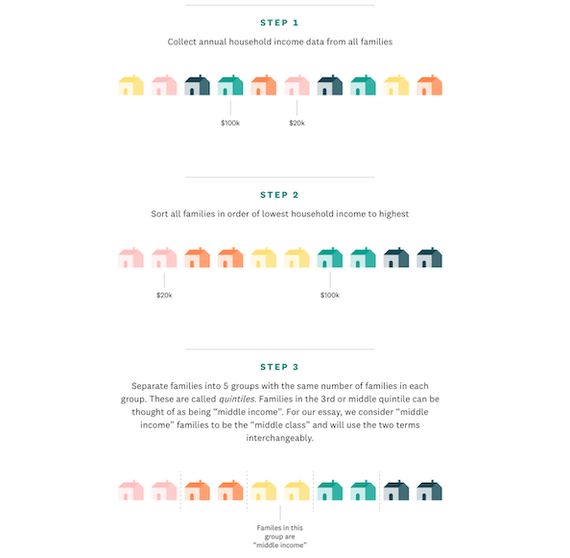
Here are some examples of strong data viz work.
The Pudding
How rigid is the middle class in the US, really?
BBC
How the BBC Visual and Data Journalism team works with graphics in R
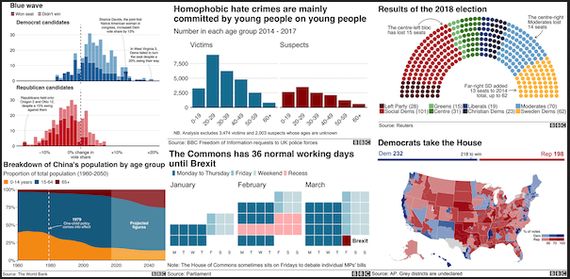
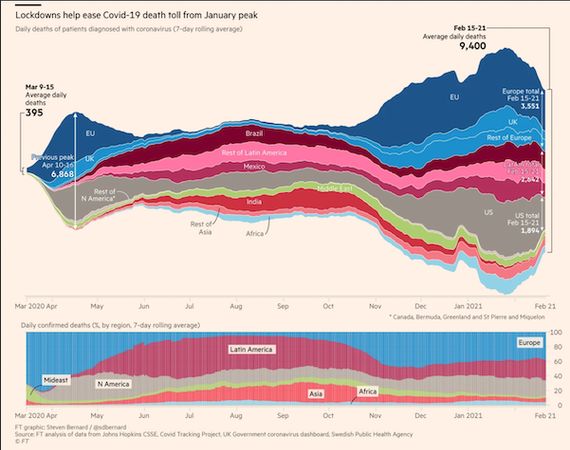
Financial Times
Collection of the FT’s data visualisation work
The Economist
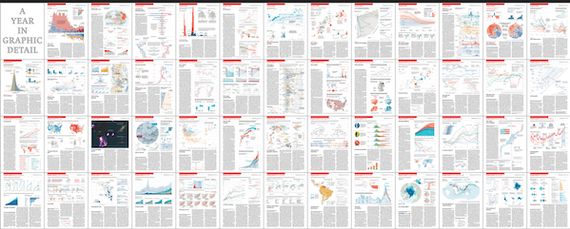
You’ll notice some of these have to work with subject matter that, in the wrong hands, could be considered as dry as dust. What they do with it however is use visualizations to make the subject easier to understand, easier to digest for a non-expert audience and make the reader more engaged with what they are looking at.
That doesn’t mean we have to offer data viz to those industry leading standards but keeping in mind what our ultimate goal is should always be our viz focus. Does it make the subject easier for the reader to quickly understand? If the answer is no then try again.
Look outside your normal sphere for inspiration.

Expand your reach into reading tips and advice from copywriters, content marketers, other data folks, fiction writers, non-fiction writers, comedians, screenwriters, sports writers, etc etc etc.
Mine all of their content for something to give your storytelling an edge. Subscribe to their email newsletters and read their back catalogue and greatest hits. What in their writing makes an impact on you? What can you learn from that to use in your own storytelling?
Remember, talent borrows, genius steals. There has never been a better time to have access to folks like these who are ready and willing to give away their knowledge, often for free and with no expectations of anything in return. Fill your boots.
Some of my own favourites are:
Want to learn more from the real experts?
These are some of my favourite books and articles on the craft of writing and storytelling.
Books
Stephen King - On Writing
John Yorke - Into The Woods
Anne Lamott - Bird by Bird
Will Storr - The Science of Storytelling: Why Stories Make Us Human, and How to Tell Them Better
Chuck Palahniuk - Consider This: Moments in My Writing Life After Which Everything Was Different
Articles / Threads
The Pudding’s Guide To Storytelling (NB: if you read nothing else please read this one, it’s :chefs-kiss: )
Ernest Hemingway’s top 5 tips for writing well
Writer’s Toolbox Tips from the Masters
Kurt Vonnegut’s greatest writing advice
Data Visualization (deserves a special section of it’s own)
Albert Cairo - How Charts Lie
Cole Nussbaumer Knaflic - Storytelling with Data : Books : Podcast
Alli Torban - Data Viz Today : Podcast : I interviewed Alli for an Analysts Assemble Q&A back in 2019
Andy Kirk - Visualising Data